THE CRYSTAL STRUCTURE OF ALAMOSITE, PbSiO3
by
Michael L. Boucher
A dissertation submitted in partial
fulfillment of the requirements
for the degree of
Master of Science in the
University of Michigan
1967
Acknowledgements
The author would like to thank Dr. D. R. Peacor for his assistance, suggestions, and encouragement on this study. Thanks also are due to Dr. P. L. Cloke for his help and assistance in the synthesis work and to Dr. C. Frondel for the natural material eventually used in the study.
This work was part of a study supported by a National Science Foundation Grant.
ii
TABLE OF CONTENTS
Page
Appendix 32
Bibliography
53
iii
LIST OF TABLES
Table Page
1 Physical Properties of Alamosite 2
2 Chemical Analysis of Alamosite 4
3 Calculation of Unit Cell Contents, Z, for Alamosite 5
4 Comparison of the Results of Mackay and This Study 7
5 Comparison of the Unit Cells of Alamosite and Parawollastonite 7
6 Refined Coordinates and Isotropic Temperature Factors for Alamosite, P2/n 22
7 Lead-Oxygen, Silicon-Oxygen, Silicon-Silicon and Lead-Lead Interatomic Distances for Alamosite 26
8 Oxygen-Oxygen Distances, Silicon-Oxygen-Silicon and Oxygen-Silicon-Oxygen Angles for Alamosite 27
9 Alamosite Powder Patterns, PbSiO3 35
10 Final Structure Factors for Alamosite 36
iv
LIST OF ILLUSTRATIONS
Figure Page
1 Sketch of Alamosite Crystal (Palache and Merwin, 1909) 3
2 Unit Cell Relations, B2/c, P2/c, and P2/n, projected on (010) 10
3 Zero and First Level Weissenberg Photographs of Alamosite Intensity Crystal 11
4 2-Dimensional Projection down the b-axis of the Patterson Function, P2/n cell 13
7 Silicon tetrahedral chain in Alamosite, projected down the b-axis, P2/n 23
8 Alamosite structure showing bonding relations in full cell projection. (P2/n cell) 29
9 Lead Polyhedral Chain in Alamosite, projected down the b-axis, P2/n 30
V
THE CRYSTAL STRUCTURE OF ALAMOSITE
PbSiO3
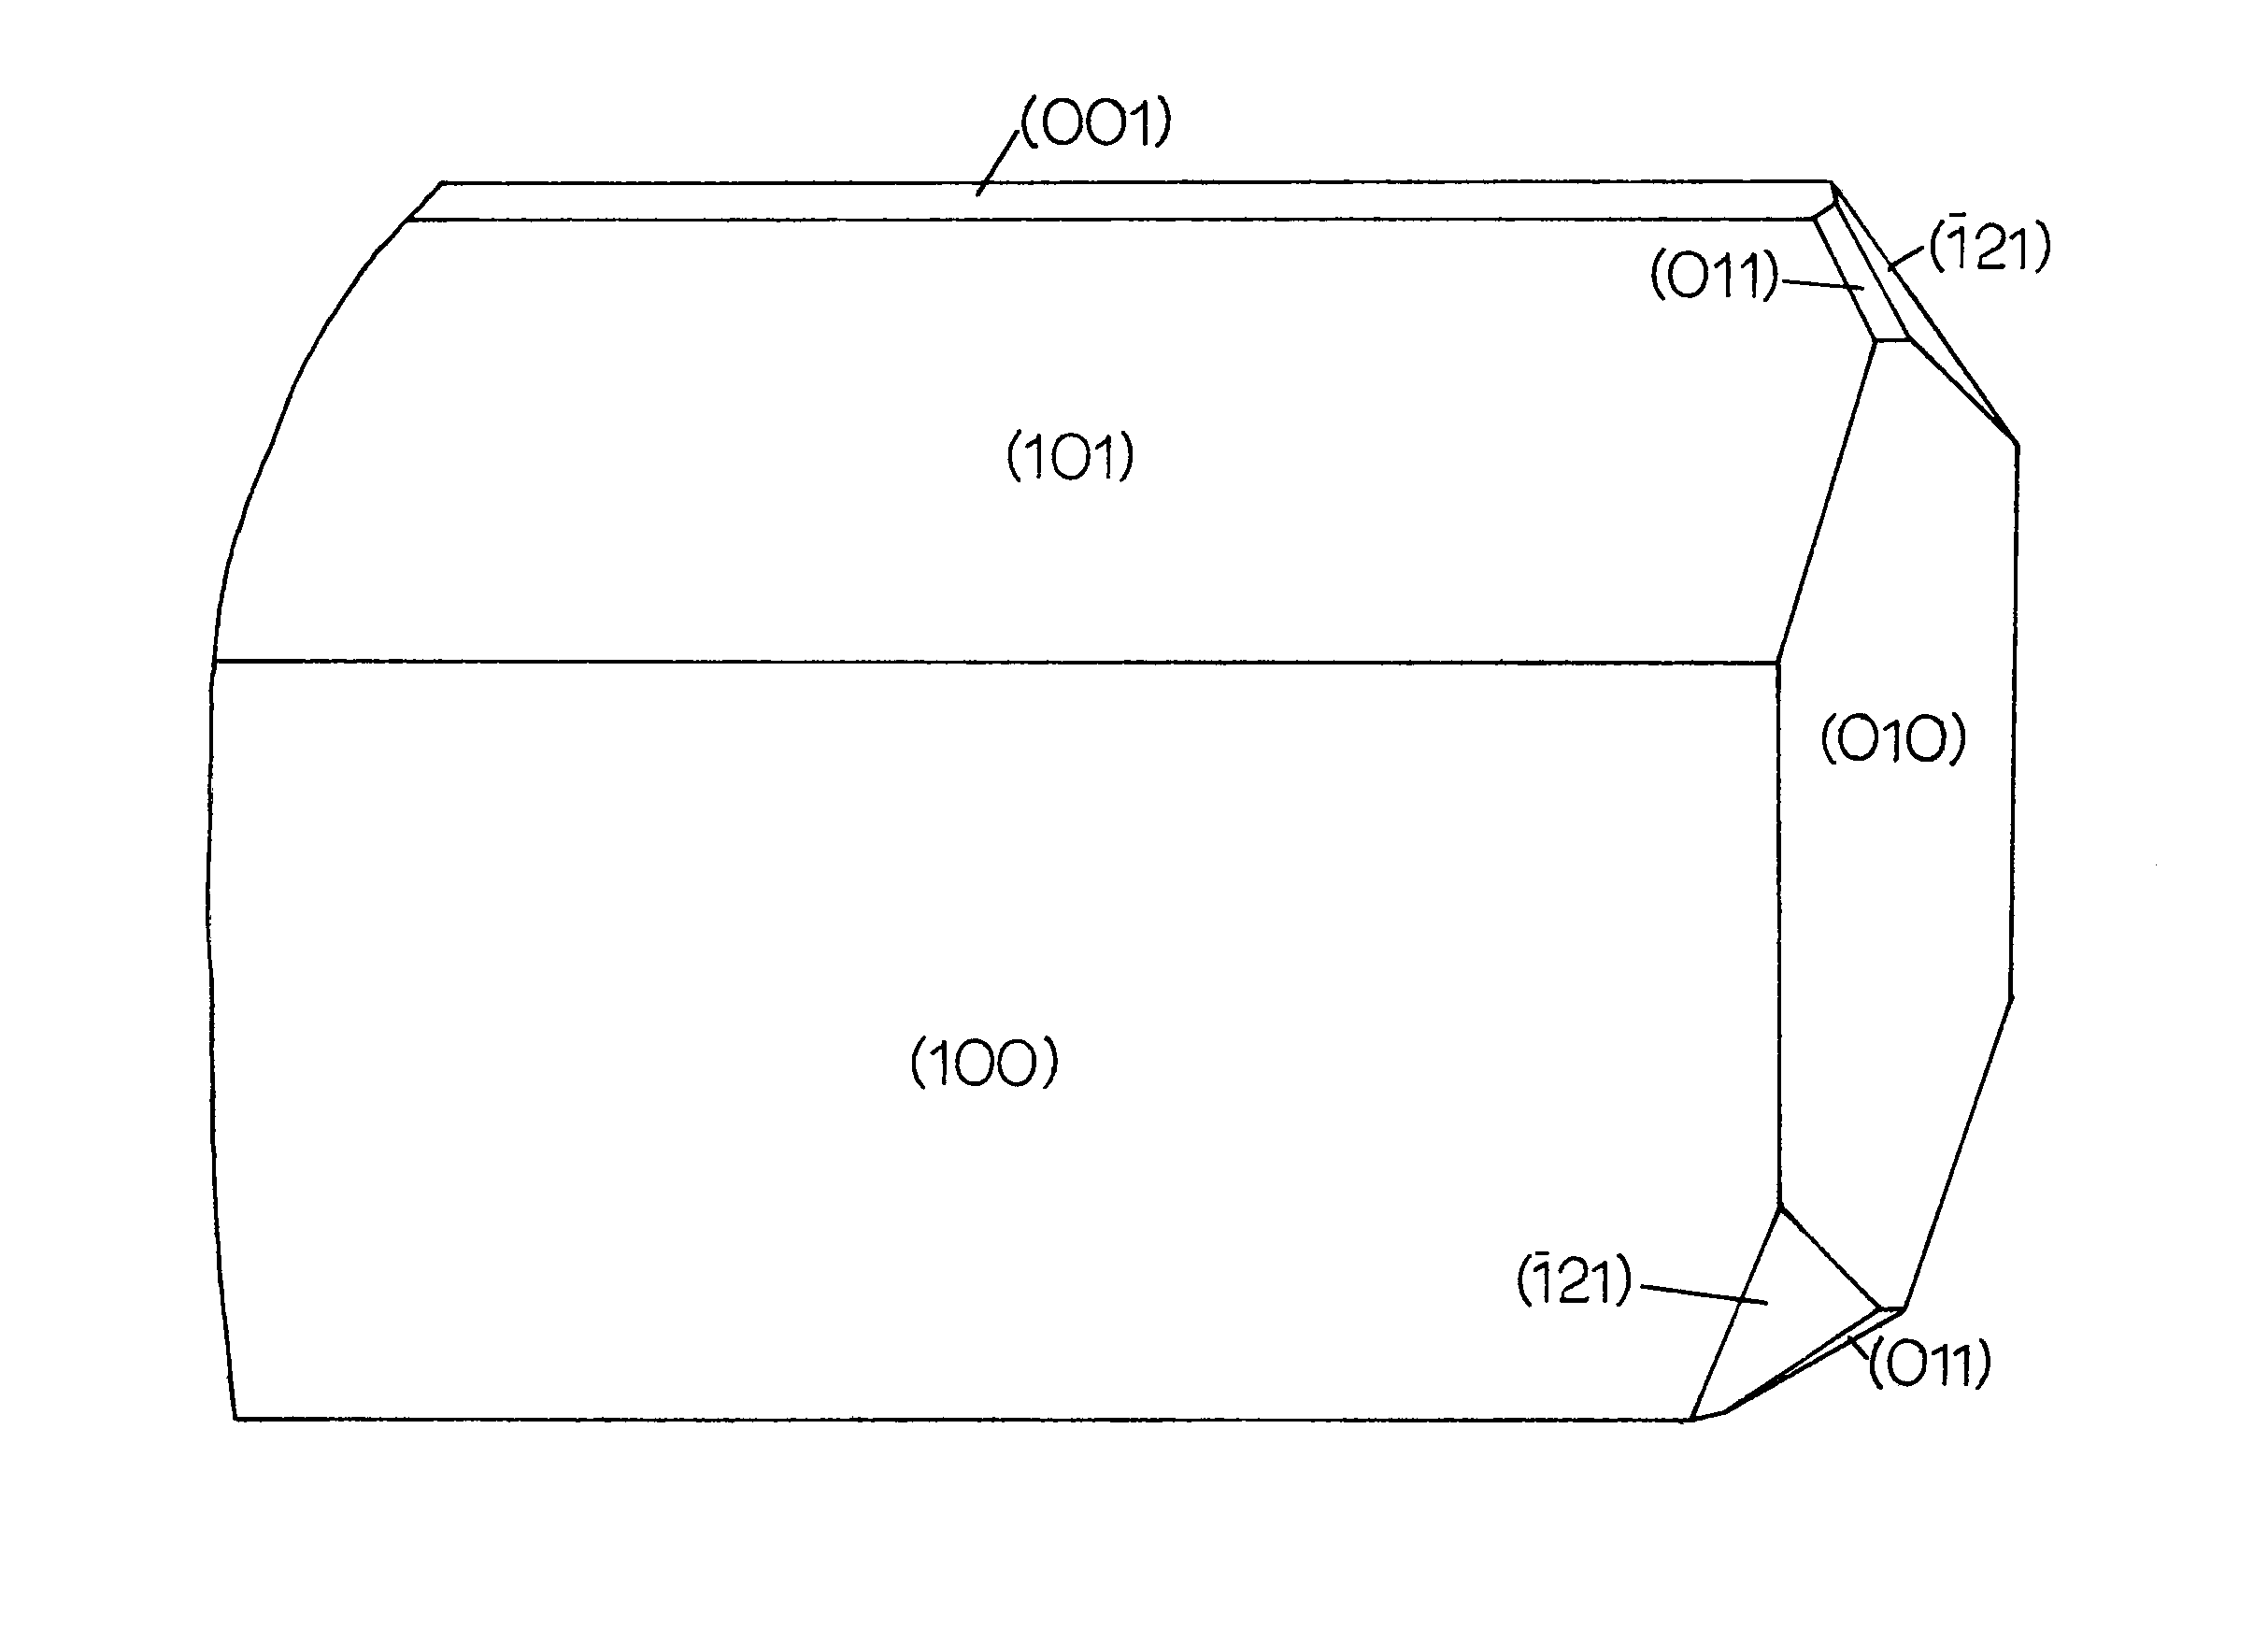
Alamosite was first discovered and named by Palache and Merwin (1909). The only known occurrence is in an undeveloped gold-copper prospect near Alamos, Sonora, Mexico where it is associated with quartz, cerussite, wulfenite, and leadhillite. Palache and Merwin (1909) determined that alamosite is monoclinic (psuedohexagonal) using optical goniometric measurements and they obtained an axial ratio very close to that determined by x-ray methods. They obtained the axial ratio a:b:c of 1.375:1:0.924; the author obtained a ratio c/2:b:a/2 of 1.382:1:0.923.
Palache and Merwin (1909) made a density determination, Table 1, and also a chemical analysis of a small sample of alamosite, Table 2. No other analysis has ever been reported. Merwin's density of 6.488± .003 was somewhat high when Z, the number of formula weights of PbSiO3 per unit cell was calculated. A density determination by the author, using a Berman Balance yielded a value of 6.316 ± .015. This value gave a somewhat lower value for Z than the ideal value of 12.0 and indicates that the authors density is lower than the ideal density. Table 3 compares the calculation of Z using Merwin's and the author's values for the density. The physical properties of alamosite are summarized in Table 1.
-2-
ALAMOSITE PbSiO3
Monoclinic: Space groups P2/n, B2/c, P2/c
P2/n |
B2/c | P2/c |
| a = 11.146 ± .010Å | c = 19.55 ± .05Å | a = 11.146 ± .010Å |
| b = 7.075 ± .005 | b = 7.075 ± .005 | b = 7.075 ± .005 |
| c = 12.197 ± .010 | a = 12.955 ± .010 | c = 12.955 ± .010 |
| ß= 113.25° ± .500 | ß = 95. 50° ± .500 | ß = 120.50° ± .500 |
| Z=12 | Z=24 | Z=12 |
Volume = 883.6 Å3 (P2/n cell)
Axial ratios:
Morphological (Palache and Merwin, 1909)
a:b:c = 1.375:1:0.924
X-ray (B2/c cell)
c/2:b:a/2 = 1.382:1:0.923
Physical Properties
Colorless to white; occurring in radiating aggregates; prismatic, fibrous habit; b (2nd setting) parallel to fiber direction; perfect (010) cleavage perpendicular to the fiber axis.
Luster - adamantine; Hardness - 4.5 (Palache and Merwin, 1909)
Specific Gravity - 6.488 ± .003 (Merwin-pycnometer), 6.316 ± .015 (Boucher-Berman balance)
Melting point - 764 ± 3°C (Geller and Bunting, 1936)
Optical Properties
Biaxial negative: alpha = 1.947 ± .001, beta (calculated) = l.961 ± .00l, gamma = l.968 ± .001, 2V = 65 ± 5° (Na light)
Birefringence = 0.023, strong dispersion (Merwin, 1914)
-3-

Figure 1. - Sketch of Alamosite Crystal. (Palache and Merwin 1909)
-4-
TABLE 2 CHEMICAL ANALYSIS OF ALAMOSITE (Merwin, from Palache and Merwin, 1909)Oxide |
Weight Percent |
Molecular Ratio |
Weight Percent PbSiO3 |
SiO2 |
21.11 | .348 |
21.32 |
| PbO | 78.13 | .351 | 78.68 |
| CaO | trace |
.... |
.... |
| FeO | .09 | .... |
.... |
| Residue from PbO* | .53 | .... |
.... |
| Insol. Residue, Quartz | .08 | .... |
.... |
| Totals | 99.94 | 100.00 |
*This residue was lost after weighing and was not determined.
-5-
CALCULATIONS OF UNIT CELL CONTENTS, Z, FOR ALAMOSITE (P2/n cell)
Oxide |
2 | 3 | 4 | 5 | 6 | 7 | Atom | 9 | 10 | 11 |
SiO2 |
21.11 | 21.25 | 60.09 | .354 | 12.28 | 11.91 | Si | 12.28 | 11.91 | ~ 12 |
PbO |
78.13 | 78.66 | 223.21 | .353 | 12.28 | 11.91 | Pb } | 12.28 | 11.91 | ~ 12 |
FeO |
.09 | .09 | 71.85 | .001 | Fe } | |||||
|
99.33 | 100.00 | O | 36.86 | 35.73 | ~ 36 |
Z = 12 (PbSiO3) per unit cell
Column 2 - weight percent, Column 3 - weight percent converted to 100%, Column 4 - molecular weight of oxide, Column 5 - weight percent/molecular weight, Column 6 - oxide contents/ unit cell, S.G.= 6.488, Column 7 - oxide contents/ unit cell, S.G. = 6.316, Column 9 - atoms/ unit cell, S.G. = 6.488, Column 10 - atoms/ unit cell, S.G. = 6.316, Column 11 - number of atoms/ unit cell.
Merwin’s S.G. = 6.488 Merwin (Palache and Merwin, 1909)
Boucher’s S.G. = 6.316 (This study)
-6-
The unit cell and space group were first determined by Mackay (1952). The authors data agrees in essence with Mackay's, Table 4. Mackay determined that the space group is P2/c or Pc, and assigned alamosite to the centrosymmetric group P2/c because of negative results in a piezo-electric test and the finding of many accidental absences on the single crystal photographs.
Palache and Merwin (1909) first suggested the possibility of isostructuralism between alamosite and monoclinic parawollastonite, and cited the similarity of chemical formula, the identity of crystal system and habit, and the close agreement in values of the beta angle and in the c:b axis ratios. Against the possibility of isostructuralism they cited the dissimilarity in a:b axis ratios and the differences in cleavage. Palache and Merwin gave the axial ratio of monoclinic wollastonite as 1.053:1:0.967. Mackay (1952) compared the two minerals (Table 5) and from Barnick (1935), the ratio given by Palache and Merwin is actually a/2:b:c for parawollastonite.
In his discussion of the possible isostructuralism of the two minerals, Mackay noted that the difference in ionic radii of Ca+2 and Pb+2 would cause the unit cell of alamosite to be larger than that of parawollastonite. In comparing the B-centered cell of alamosite and the P21/c cell of parawollastonite (Table 5), the alamosite a axis is larger than the a axis of parawollastonite; the b axis of parawollastonite is
C
7CCOMPARISON OF THE RESULTS OF MACKAY AND THIS STUDY
THIS STUDY |
MACKAY (1952) |
| B2/c | B2/a |
| c = 19.55Å | a = 19.96Å |
| b = 7.075Å | b = 7.03Å |
| a = 12.955Å | c = 13.06Å |
| Beta = 95.500°
|
Beta = 96.500° |
P2/c |
P2/c |
| a = 11. 146Å | a = 11.28Å |
| b = 7.075Å | b = 7.03Å |
| c = 12.955Å | c = 13.06Å |
| Beta = 120.50° | Beta = 120.00° |
COMPARISON OF ALAMOSITE AND PARAWOLLASTONITE
(Modified from Mackay, 1952)
ALAMOSITE * |
PARAWOLLASTONITE** |
a = 19.55Å |
a = 15.36Å |
| b = 7.075Å | b = 7.29Å |
c = 12.955Å |
c = 7.08Å |
Beta = 95° 30' |
Beta = 95° 45' |
Z =24 |
Z = 12 |
B2/a |
P21/c |
* This study
** M. Barnick, Mitt. Kaiser-Wilhelm-Inst. Silikatforschung, 1936, #172, Naturwiss. 1935 v. 23 p.770
-8-
larger than the b axis of alamosite; the c axis of alamosite is somewhat less than twice the c axis of parawollastonite. Mackay also suggested that the psuedosymmetry of parawollastonite (shown as halving of the b or unique axis) is not shown by alamosite and powder photographs of the two minerals are dissimilar. He concluded that they were probably not isostructural.
Mackay believed that there was a possibility of the occurrence of Si3O9rings in the alamosite structure, and suggests that the following might indicate it. He stated that the beta angle of the P2/c cell was approximately 120°, and the lattice is roughly hexagonal correlating with the hexagonal symmetry of individual rings; the (010) cleavage is excellent and could be accounted for by layers of Si3O9 rings parallel to (010); Z = 12 and if there were 4 atoms in each general position, the independent units of structure would then be 3 lead, 3 silicon, and 9 oxygen, not inconsistent with the presence of Si3O9 rings; one refractive index is widely separated from the other two and might indicate anisotropic structural units such as Si3O9 rings.
The present study began with a redetermination of the unit cell and space group of alamosite. The material used was kindly provided by Dr. Clifford Frondel from the Harvard University Mineralogical Collection, catalog number 84459, and is from the Sonora, Mexico locality. Precession, oscillation and Weissenberg photographs were taken,
-9-
using Cu radiation. The unit cell dimensions for the space group P2/c are; a= 12.96Å, b = 7.08Å, c = 11.15Å, and beta = 120.5°. These results agree generally with those of Mackay (1952), although some distances were not in close agreement (Table 4). All three cell choices (B2/c, P2/c, and P2/n, Figure 2) were used at one time in the present study. The B-centered cell corresponding to the morphological cell (except for a renaming of the a and c axes) was used in the first part of the work, but proved unwieldy due to its size and the large number of atoms to consider. The P2/n cell was chosen for the final refinement as it was the reduced cell.
Because of its fibrous habit and perfect cleavage, serious problems were encountered in attempting to select a suitable crystal for the intensity determinations. Lineage structure was very prominent and the crystal finally selected although very small, still had some streaking out of the spots on the b-axis Weissenberg photographs, parallel to (010). (Several attempts were made by the author to synthesize crystals of sufficient size for the intensity work with no success. (See appendix.) The final crystal was a tiny prism, and was mounted on the b (fiber) axis.
The first attempt at the solution of the structure involved a 2-dimensional projection down the b axis. Settings were calculated for zero level intensity measurement on the Buerger single crystal equi-inclination counter diffractometer fitted with a scintillation counter
-10-
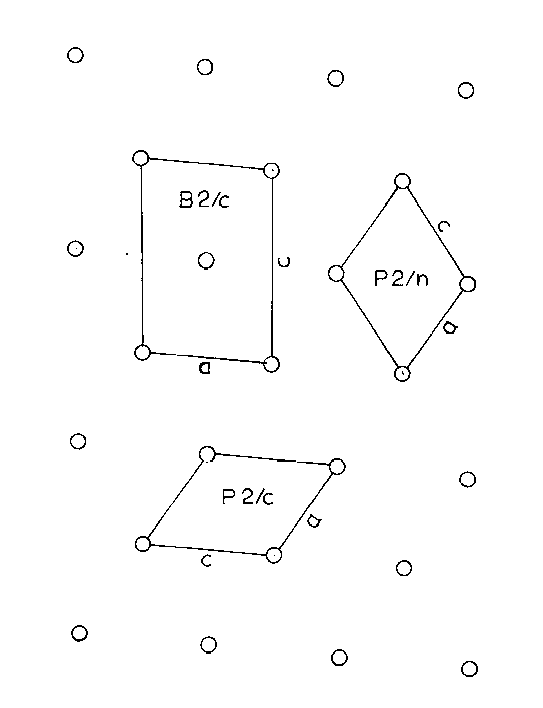
Figure 2. - Unit Cell Relations, B2/c, P2/c, and P2/n, projected on (010).
-11-
Figure 3. - Zero and First Level Weissenberg Photographs of Alamosite Intensity Crystal
-12-
detector. The settings were calculated using a modified version of the IBM 7090 Fortran II DFSET4, program written by Prewitt (1964). Because of the smearing out of the spots, due to lineage structure parallel to (010), the peak scans were recorded on a chart recorder as opposed to using direct counting methods, and the scale factors were noted. Care was taken to be sure to record the main peak and all its satellites. Therefore, each scan was begun well before, and continued well beyond the peak. The background level for each peak was averaged, and the area of the peak above background level was planimetered twice. The two results were averaged, giving a value for each reflection.
These values were then corrected for Lorentz-polarization factors, but not for absorption, using the program DFSET4. The 2-dimensional Patterson function P(uw) was then calculated using an IBM 7090 Fortran II Fourier synthesis program. The results were plotted and contoured (Figure 4) with the projection symmetry of P2. The number and non-special positions of the peaks suggested that only the Pb-Pb vectors had been resolved and that the Pbs were in general positions. A calculation of the relative weights of the peaks expected showed all but the Pb-Pb peaks to be very little above background. It was then assumed that all the resolved peaks were due to Pb and using Buerger's (1959) conjugate peak method, three peaks were chosen as possible single weight inversion peaks.
-13-
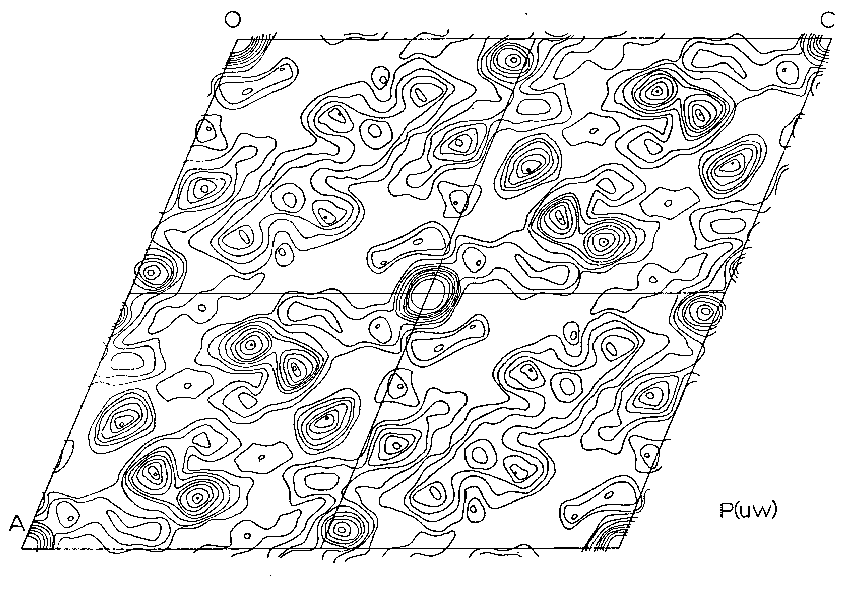
Figure 4. - 2-Dimensional Projection down the b-axis of the Patterson Function, P2/n cell
-14-
Two different minimum functions M2(xz) were obtained, the third peak giving a solution identical to one of the other two. These two functions, MA2(xz) and MB2(xz), were combined to form an MAB4(xz) function (Figures 5, 6) which shows three large peaks per asymmetric unit. These three very large peaks were assumed to be lead atom positions. Structure factors were calculated on the basis of these coordinates using a modified IBM 7090 Fortran II least square program written by Prewitt (1962), SFLSQ2, which by refining the overall scale factor and the lead coordinates converged with an R-factor of 24 percent. The electron density function rho(xz) (Figure 6) was calculated and showed the predicted large peaks, corresponding to Pb, as well as some smaller less well defined peaks. An attempt was made to see if these peaks might represent silicon or oxygen positions and their coordinates were used in the program SFLSQ2 with no success. An electron difference function delta rho(xz) was calculated with no positive results. At this time it was decided to attempt a 3-dimensional solution.
During the summer of 1965, 3-dimensional intensity data (again with the B-centered cell) was collected. The same technique and the same crystal were used as for the 2-dimensional analysis. Settings were calculated from the zero through the seventh level, but due to the mechanics of the diffractometer, many reflections were not measurable, including most of the seventh level. Again the data was corrected for Lorentz-polarization factors, but not absorption.
-15-
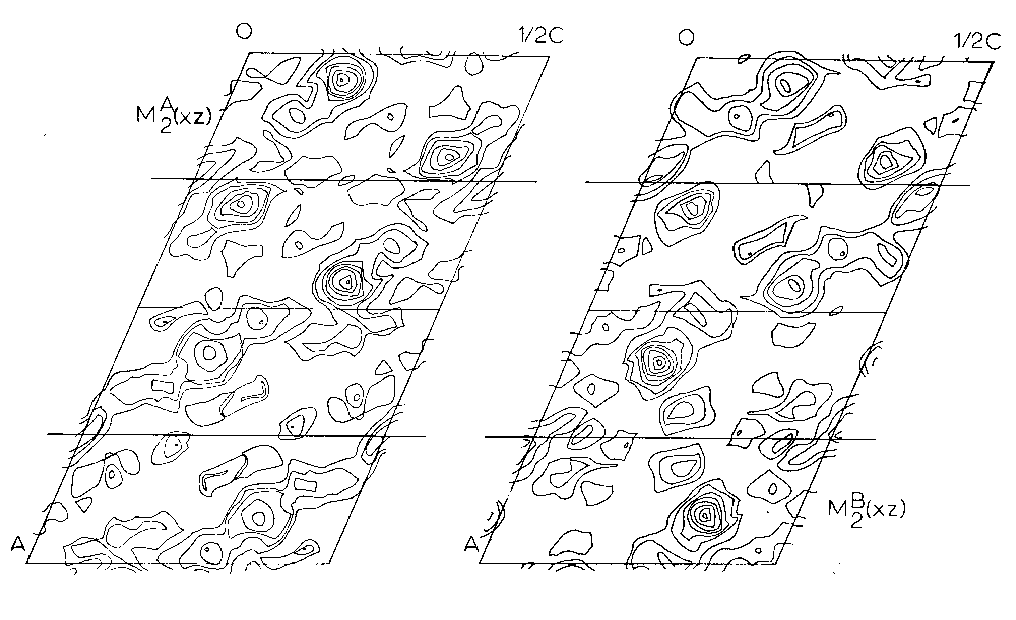
Figure 5. - Asymmetric units of The Minimum Functions MA2(xz) and MB2(xz) projected down the b-axis of the P2/n cell
-16-
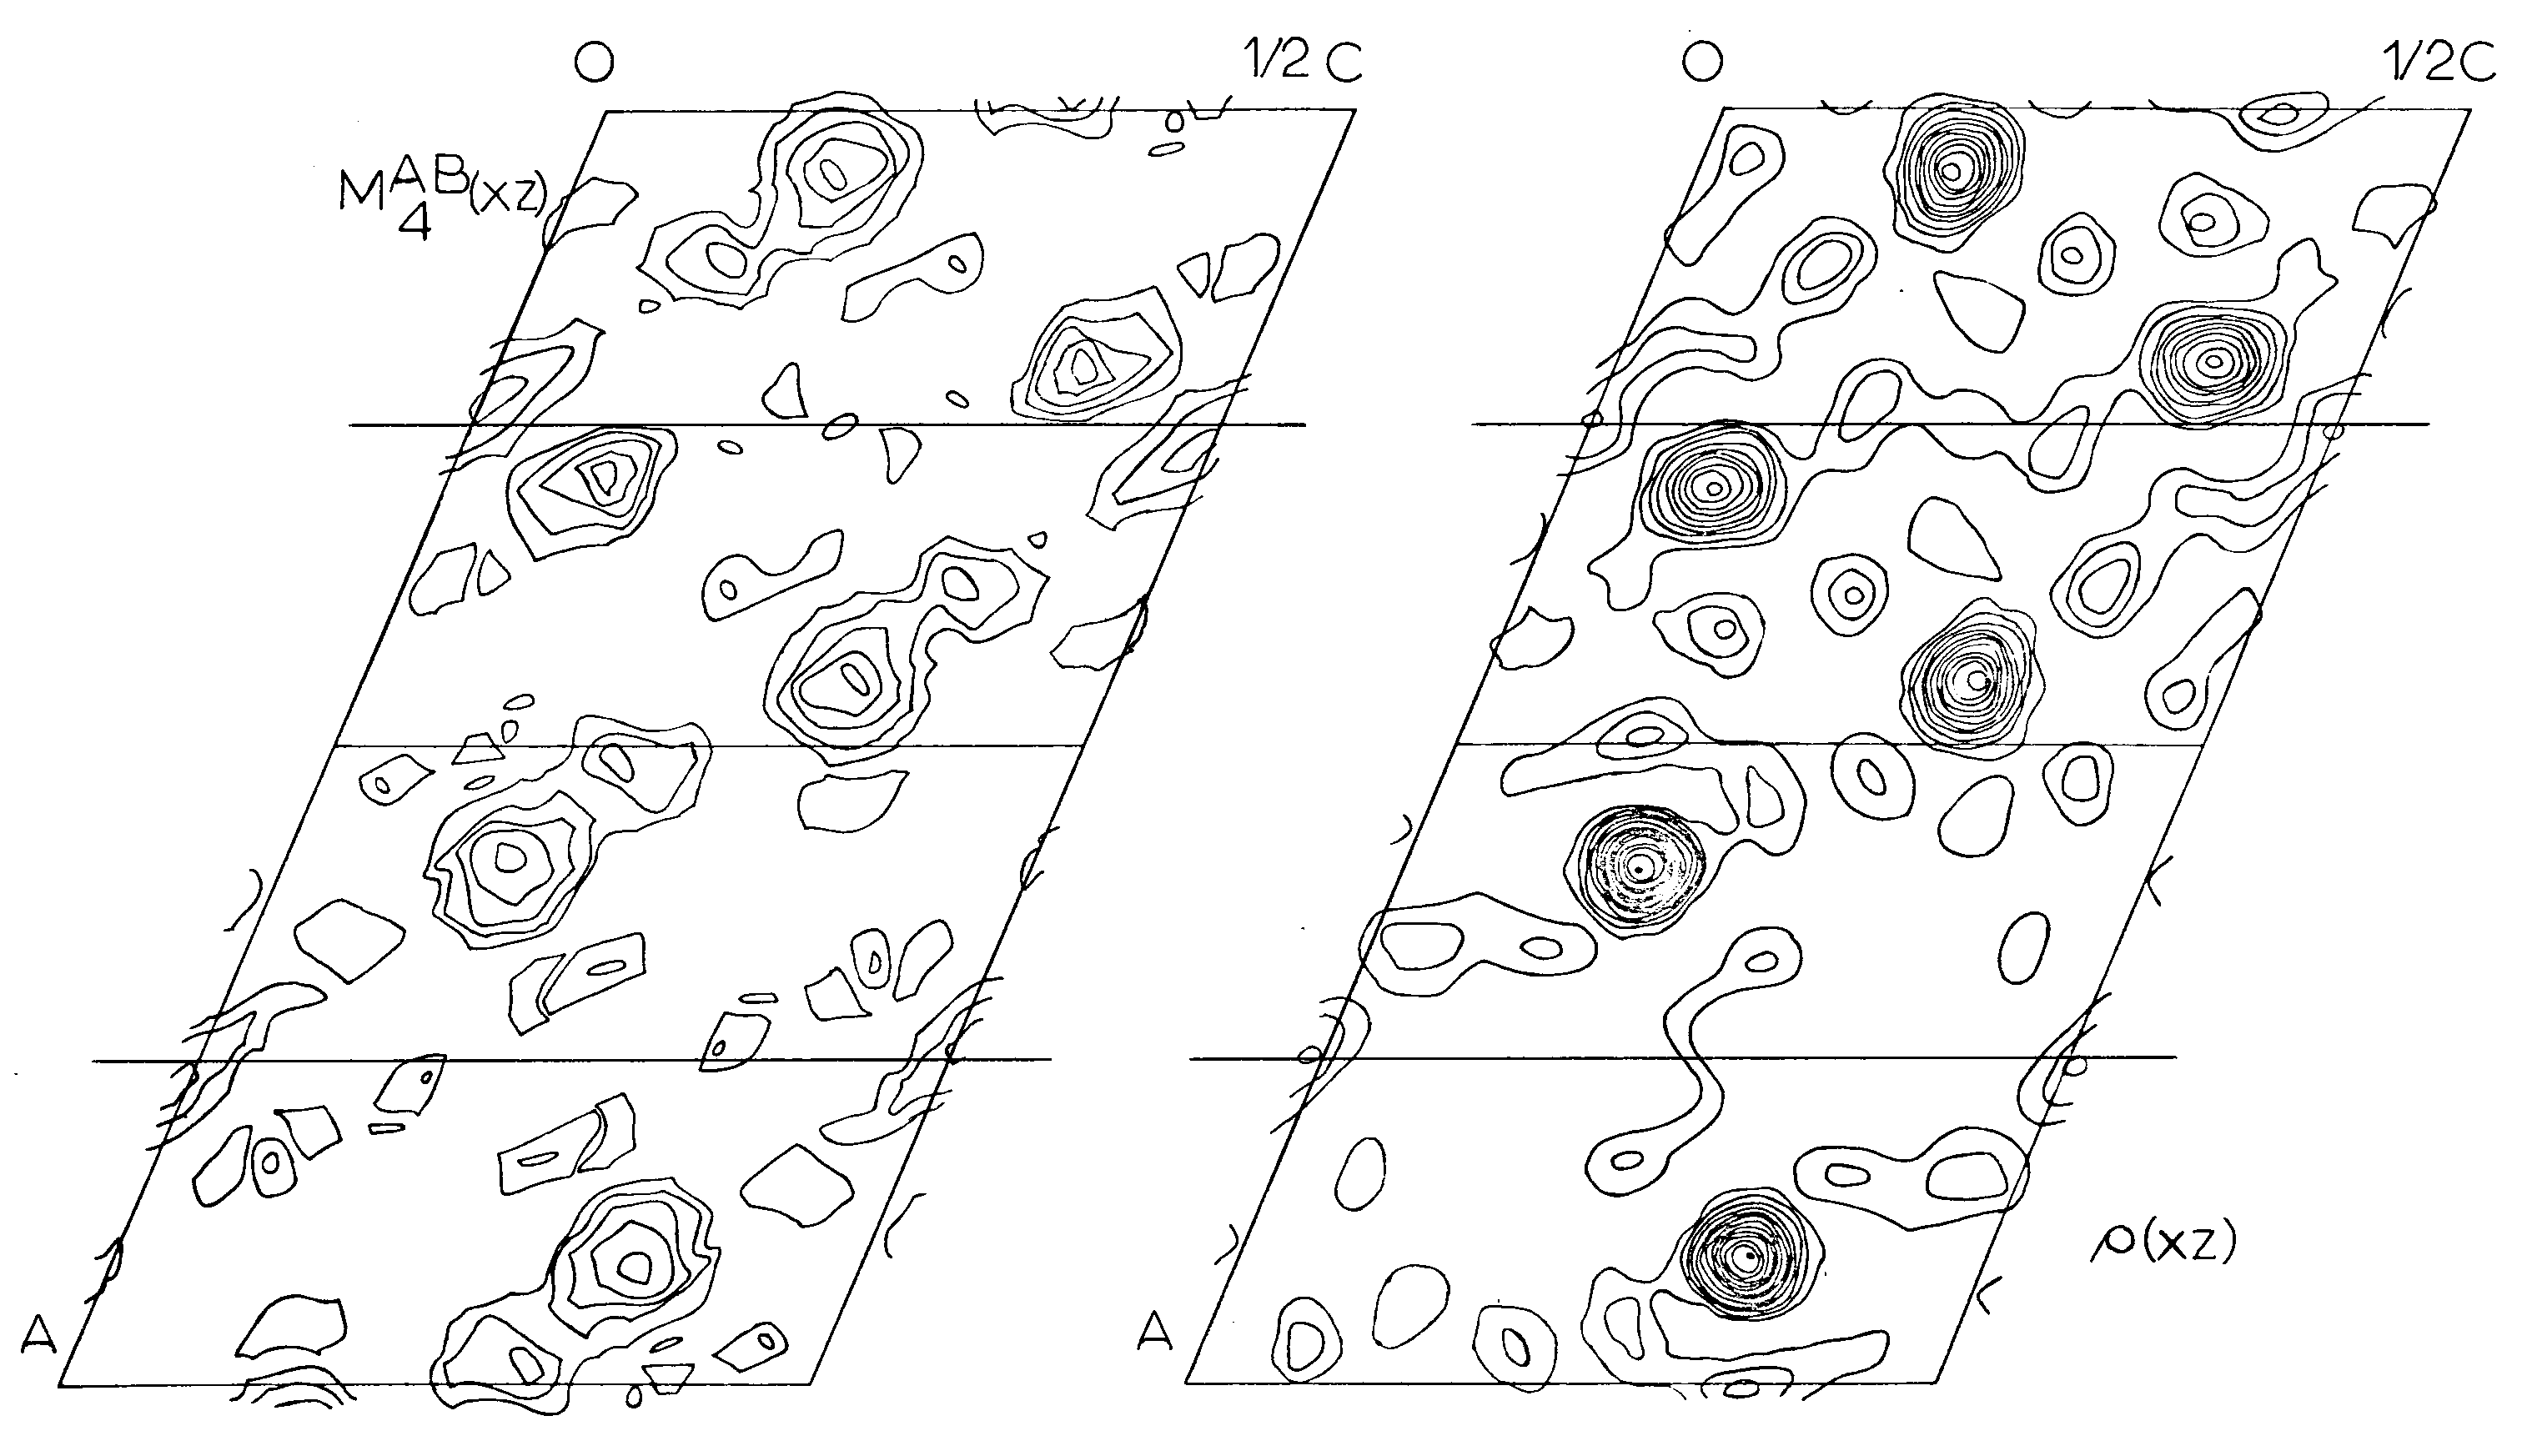
Figure 6. - Asymmetric units of the minimum function, MAB4B(xz) and the final 2-D electron density function, rho(x,z), projected down the b-axis of the P2/n cell
- 17 -
It was at this point that the P2/n cell was substituted and used for the rest of the study.
The 3-dimensional Patterson function P(uvw) was calculated for the asymmetric unit using a 3-dimensional Fourier IBM 7090 FAP program written by C. Nordman of the University of Michigan, Department of Chemistry. Sections were chosen with y equal to 0/60, 3/60, 6/60, 9/60, 12/60, 15/60, 18/60, 21/60, 24/60, 27/60, and 30/60.
All peaks that were significantly above the background were plotted with their peak height and cell height (y) onto a single sheet. A series of very large peaks high above the background were noted. These were overlaid onto the 2-dimensional Patterson and there was a direct correspondence in position and relative peak heights.
While checking the lead positions and working out their y coordinates, it was discovered that the peaks chosen in the 2-dimensional analysis were not inversion peaks, but were Pb-Pb rotation peaks, the rotation operation of three dimensions corresponding to inversion in projection. This meant that a two-fold axis was at the origin instead of an inversion center as had been believed. A single weight inversion peak was found and the lead coordinates were shifted (l/4)a and (l/4)c from the 2-D work. The y coordinates were then determined from the Patterson peak relations and the coordinates of the three leads were used to calculate new structure factors.
The resulting set of signed structure factors was used to
-18-
calculate the electron density function rho(xyz) with sections cut at the same values of y as the Patterson function. The program used to calculate this function was written by R. L. Freed for the IBM 7090. This electron density function showed three non-equivalent peaks in addition to the lead peaks. These peaks were of moderate density and intermediate height above background when compared to the lead peaks. It was assumed that these might be the silicon peaks, due to their number and inter peak distances of about 3.0Å. Their coordinates were used as the basis of several cycles of refinement using the program SFLSQ2. Their coordinates readily converged, and the final set of signed structure factors was used to calculate another electron density function rho(xyz). Unfortunately, no peaks of any size above background appeared that might have corresponded to possible oxygen positions.
Since no oxygen atoms were located at this stage, a geometric solution was attempted. The silicons were assumed to be tetrahedrally coordinated and the distances between the adjacent silicons were calculated using a modified version of the Fortran function and error program by Busing, Martin, and Levy (1964) ORFFE. Si-Si distances of 2.9-3.3Å were considered to indicate vertex sharing of the tetrahedra.
The silicons were plotted and an oxygen atom was placed between the silicon atoms believed to be sharing an oxygen. Approximate x and z coordinates were taken off the sheet and an inspection of the electron density function rho(xyz) in the immediate region of the postulated bridging oxygens was made. Four bridging oxygens were postulated and there were
- 19-
small peaks in the background of rho(xyz) in the vicinity of where these oxygens should have been. Due to the lattice symmetry, two bridging oxygens were located in special positions; one on an inversion center, and another along a two-fold axis. Their approximate coordinates (plus the fixed coordinates for the inversion center oxygen and the x and z of the two-fold axis oxygen) were used in the program ORFFE to check the Si-O distances. The distances were quite reasonable and with these oxygens as a start, it was hoped the rest could be found. Since each silicon shares two of its four oxygens and the positions of these two are known, the approximate orientation of the tetrahedra could be found. Again, the function rho(xyz) was examined and many trial coordinates were determined and eventually discarded. A final trial set was placed in the least squares refinement program SFLSQ2, to see if they would converge to reasonable positions. The resulting coordinates were used in the Program ORFFE to calculate the intra-tetrahedral distances and angles. As a result, several oxygen positions were rejected as being entirely unsatisfactory.
Since the oxygen positions were expressed as very low nebulous peaks in rho(xyz), it was decided to attempt to calculate a 3-D electron density difference function delta rho(xyz). The function delta rho(xyz) was calculated using the Fobs. - Fcal. which were calculated with only contributions from lead and silicon atoms. Therefore, the oxygens were the only significant difference in the density function, while
-20-
the lead and silicon cancelled out. The oxygens showed up as diffuse but defined peaks above background. The difference map verified many of the positions, although some were corrected slightly; the rest were new positions. The coordinates were used in the program ORFFE and were found to be reasonable with respect to calculated interatomic distances. These oxygen positions were refined in the least squares program SFLSQ2 and the resulting coordinates were again checked using the program ORFFE. The resulting distances and angles were found to be in good agreement with those reported for other silicate structures.
A further refinement of the structure was attempted, using the least squares program SFLSQ2, alternating the varying of the atom coordinates with the varying of individual isotropic temperature factors. It became apparent at this time that several of the very large Fobs., were subject to error. Despite the close agreement of most of the Fcal. with Fobs., these particular reflections were consistently lower than Fcal. as a result of extinction errors. As a result, they were subsequently not used in the refinement along with all reflections with F = 0.0. The weighting scheme used to continue the refinement was that suggested by Cruickshank (1965) and may be expressed as (sigma)2 = 2a + |Fobs.|+ b(Fobs.)2, where a = 2 |Fmin.| and b = 2/ |Fmax.|. The final unweighted R-factor was 10.4 percent and the weighted R-factor was 13.4 percent, without the reflections with F = 0.0 and the reflections subject to extinction errors. The refinement was not continued by the author with respect to anisotropic temperature factors or corrections
-21-
for anomalous dispersion and for absorption as it was believed that since there were a large number of reflections rejected because of poor correspondence with Fcal. that the limits of accuracy of the data had been reached. The final atom coordinates and isotropic temperature factors are listed in Table 6. Final structure factors are compared with Fobs., Table 10.
The structure of alamosite consists of infinite chains of silica tetrahedra, paralleling [101] (Space group P2/n), and interlinked by infinite spiral chains of lead polyhedra which extend parallel to [010]. There are 12 silica tetrahedra per unit cell linked in one continuous chain. A basic unit of 3 tetrahedra is repeated by the symmetry elements of the cell to form the chain. Between and perpendicular to these silica chains are infinite spiral chains of lead polyhedra, with a repeat unit of 3 polyhedra. The P2/n cell contains sections of 4 of the lead chains with the enclosed sections being 3 polyhedra long and parallel to the b axis. (Figure 4)
This particular silicate chain structure is unique in the pyroxene-pyroxenoid mineral groups. (See Prewitt and Peacor, 1964) There are 3 non-equivalent silicons and 10 non-equivalent oxygens. The silicons are in the general position, of rank 4, as are 8 of the oxygens. The other 2 oxygens are in special positions of rank 2. Both of these oxygens are bridging oxygens. O(1) is on an inversion center
-22-
REFINED COORDINATES AND
ISOTROPIC TEMPERATURE FACTORS FOR ALAMOSITE P2/n
Atom |
x |
sigma (x) |
y |
sigma (y) |
z |
sigma (z) |
B |
sigma (B) |
Equipoint Rank |
Pb(1) |
.545 | .0004 | .066 | .0006 | .674 | .0003 | .78 | .08 | 4 |
Pb(2) |
.409 | .0004 | .386 | .0006 | .847 | .0003 | .55 | .07 | 4 |
Pb(3) |
.299 | .0004 | .304 | .0006 | .100 | .0003 | .66 | .08 | 4 |
Si(1) |
.615 | .0029 | .126 | .0045 | .155 | .0025 | -.07 | .50 | 4 |
Si(2) |
.530 | .0028 | .407 | .0046 | .392 | .0026 | .25 | .53 | 4 |
Si(3) |
.713 | .0029 | .182 | .0043 | .963 | .0025 | .32 | .54 | 4 |
O(1) |
.500 | .500 | .500 | 2.31 | 2.40 |
2 | |||
O(2) |
.750 | .224 | .0121 | .250 | 2.94 | 2.72 |
2 | ||
O(3) |
.645 | .0052 | .235 | .0083 | .458 | .0047 | 2.81 | 1.84 |
4 |
O(4) |
.654 | .0053 | .060 | .0084 | .041 | .0048 | 1.60 | 1.51 |
4 |
O(5) |
.506 | .0053 | .281 | .0083 | .105 | .0046 | 2.15 | 1.66 |
4 |
O(6) |
.578 | .0053 | .952 | .0083 | .215 | .0047 | 1.06 | 1.32 |
4 |
O(7) |
.397 | .0054 | .295 | .0081 | .300 | .0047 | 1.29 | 1.39 |
4 |
O(8) |
.423 | .0052 | .426 | .0087 | .671 | .0048 | 1.23 | 1.34 |
4 |
O(9) |
.623 | .0053 | .364 | .0082 | .909 | .0048 | 1.85 | 1.43 |
4 |
O(10) |
.717 | .0054 | .051 | .0080 | .855 | .0048 | 1.01 | 1.31 |
4 |
-23-
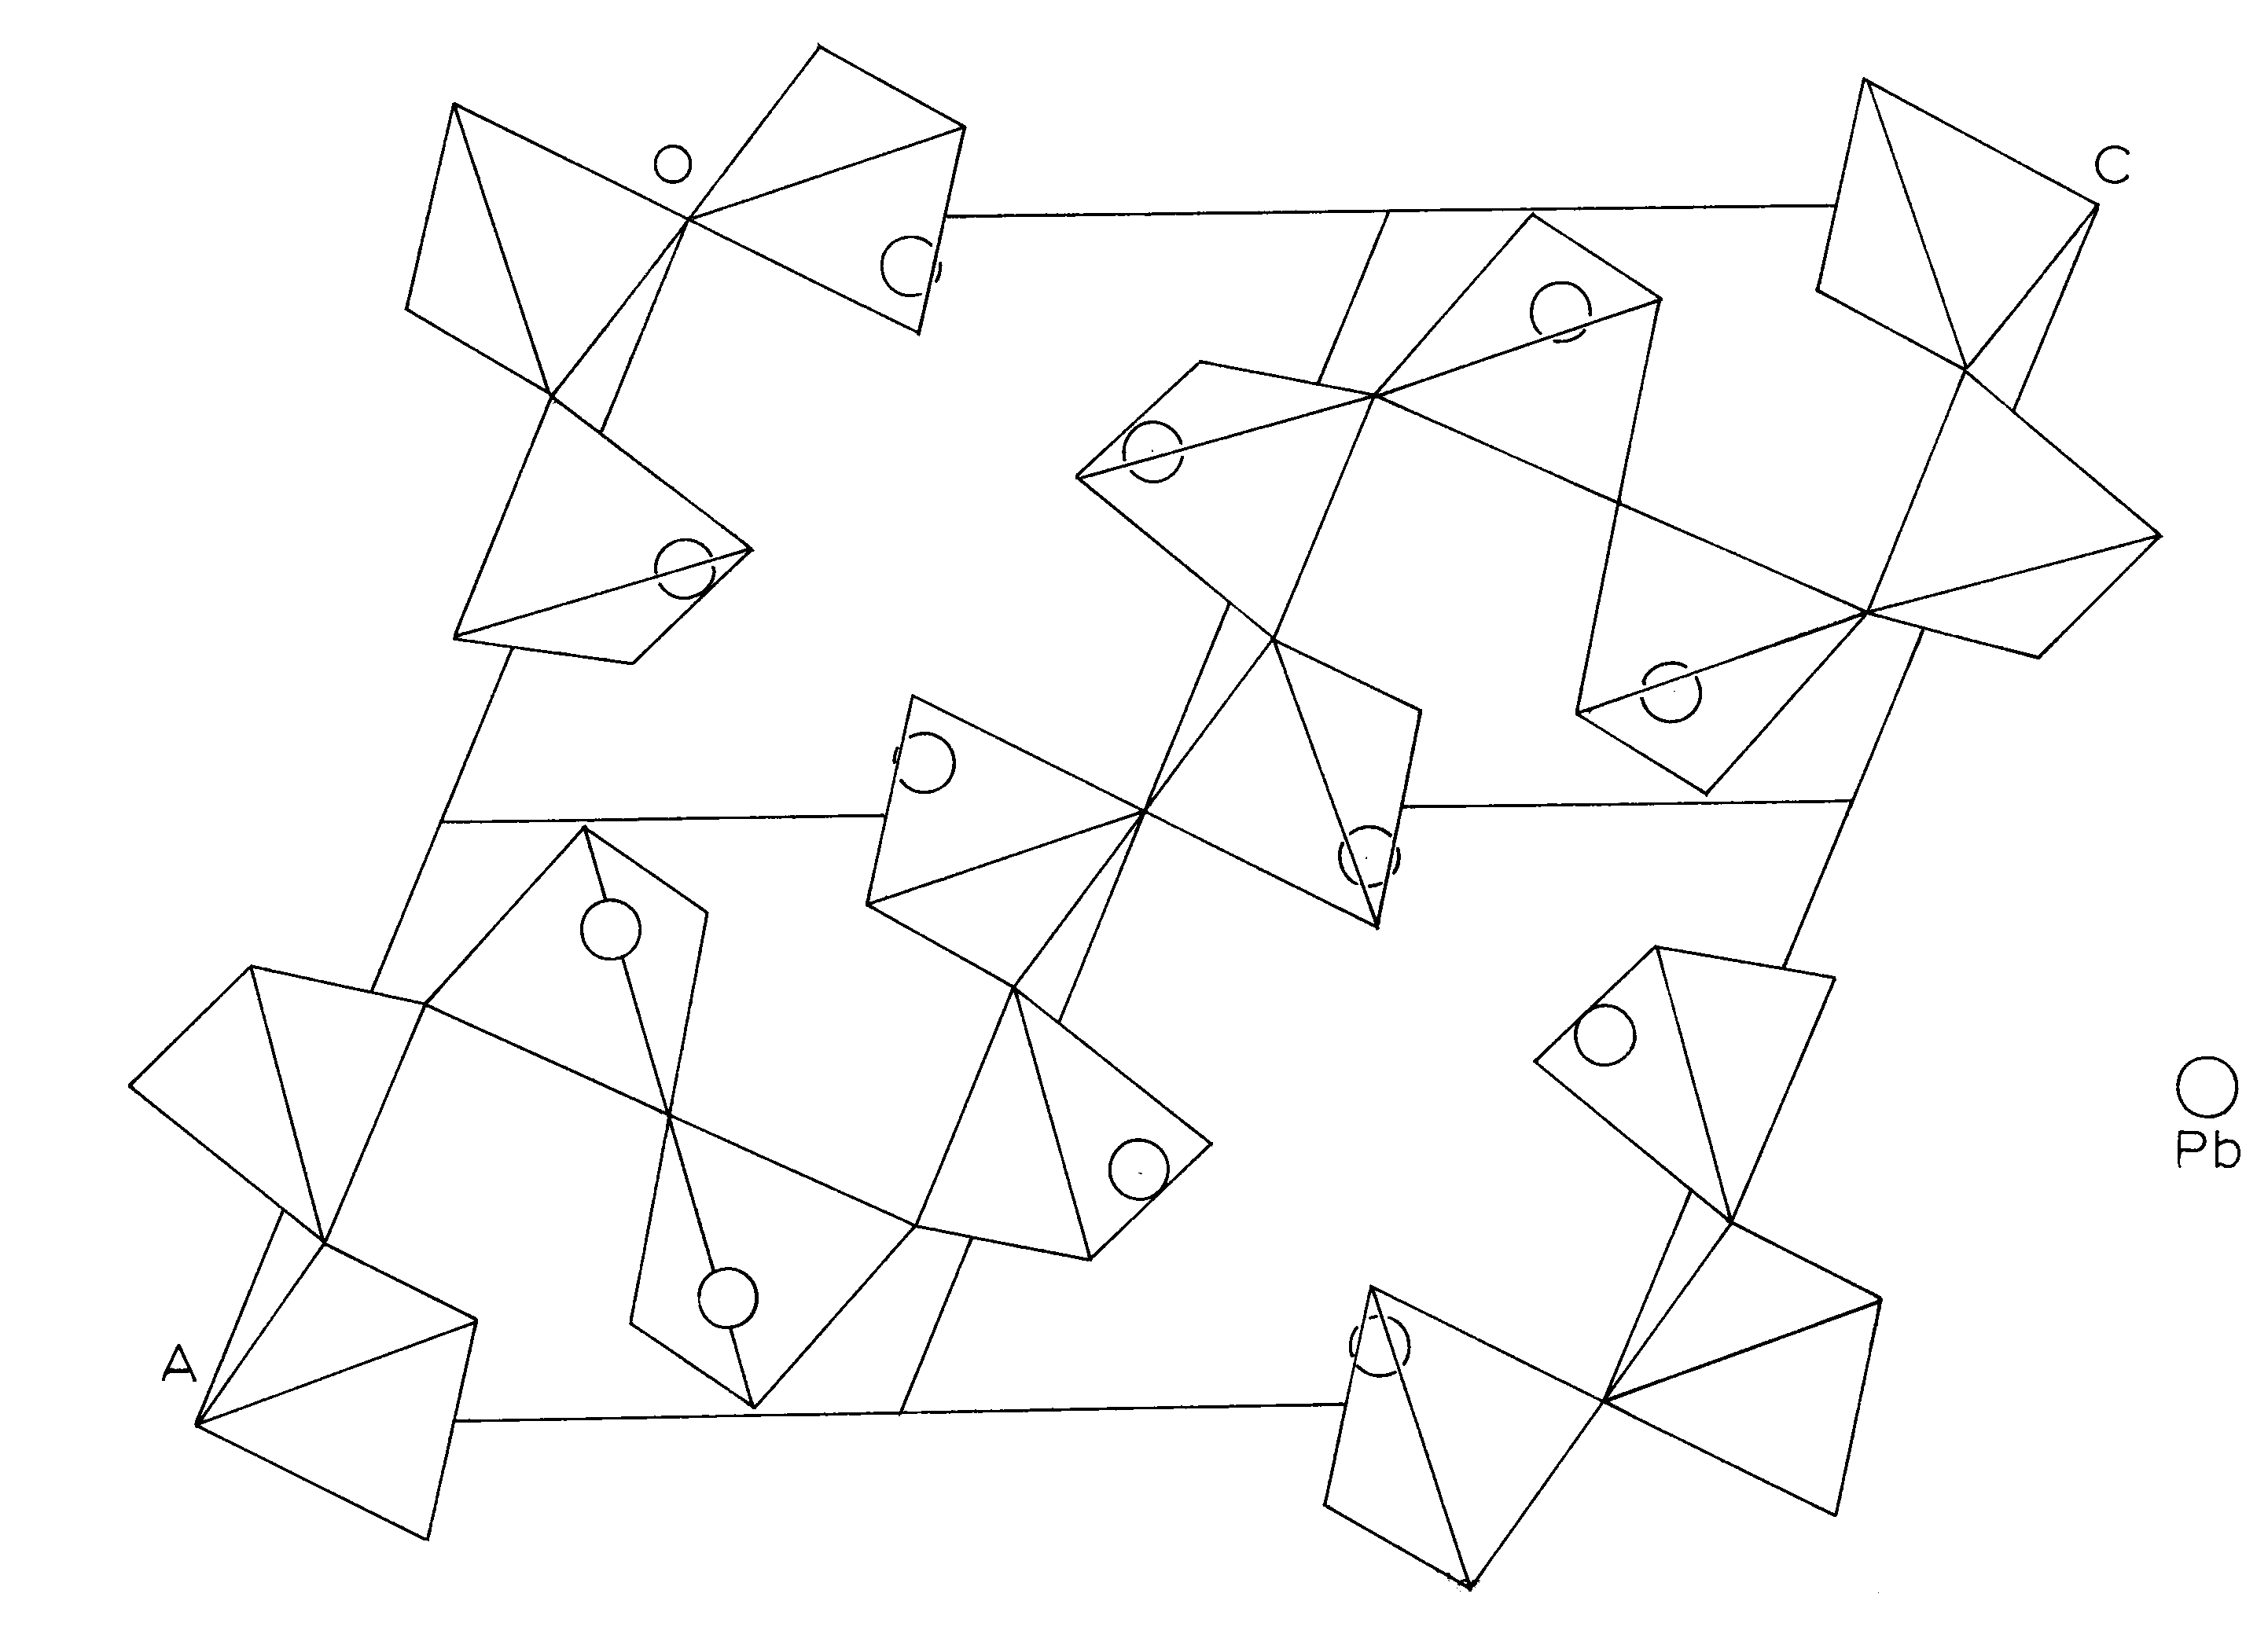
Figure 7. -
Silicon tetrahedral chain in Alamosite, projected down the b-axis, P2/n
Circles represent Lead atom positions
-24-
and O(2) is on a two-fold axis. The other two bridging oxygens are O(3) and O(4). The four bridging oxygens are shared only by two silicons each, while O(5)-O(l0) are shared by both the silicons and the leads.
The O(1) is on an inversion center, and therefore requires that the Si(2)-O(1)-Si(2) bond angles be 180°. The other angles are: Si(2)-O(3)-Si(3), 149°; Si(l)-O(2)-Si(1), 130°; and Si(3)-O(4)-Si(1), 129.7°. According to Liebau (1961), most well-determined silicate structures with vertex sharing tetrahedra have average Si-O-Si bond angles of about 140°. He further suggested that if a 180° bond angle was required by a centrosymmetric space group, then the actual space group should be acentric, and the actual angle would be only about 160°.
To investigate this possibility, Cruickshank, et.al. (1962) refined the structure of thortveitite, Sc2Si2O7 in detail. This structure has an oxygen atom on a mirror plane with a Si-O-Si bond angle of 180°. They used the centrosymmetric space group C2/m (which the previous structure determination was based on) and its acentric alternatives, C2 and Cm. The R-factors at the end of the three separate refinements were not significantly different, but the distances and angles required within the individual tetrahedra were much more acceptable for the centered group C2/m than for the acentric group. From this, Cruickshank et.al. concluded that a Si-O-Si bond angle of 180° is much more acceptable than the tetrahedral distortions required to lower the bond angle. Further, Zoltai and Buerger (1959) have found a bridging oxygen on an inversion center in coesite, with a 180° bond angle.
-25-
In the light of the above, and with the fairly low R-factor obtained in this refinement, it would seem rea.reasonable to conclude that the 180° bond angle in alamosite does exist and that the actual space group is the centrosymmetric group, P2/n. The Si-O, Si-Si, and O-O distances are quite reasonable. The Si-O distances average 1.622Å, varying from 1.54-1.71Å; the Si-Si distances average 3.084Å and range from 2.97-3.25Å; and the O-O distances range from 2.55-2.80Å. Tables 7 and 8.
There are 3 non-equivalent leads in the general position with rank 4. These leads are 3 and 4 fold coordinated by oxygen. The Pb-O distances fall into three categories; those from 2.2-2.3Å, those from 2.5-2.7Å, and those larger than 2.8Å (Table 7). If the Pb-O distances greater than 2.8Å are not considered the lead coordination polyhedra are trigonal and diamond based pyramids, with lead at the vertex.
According to Naray-Szabo and Kalman (1961) in their study of the compound K2Pb2Si3O7, the Pb-O distances of 2.2-2.3Å indicate covalent bonds with directed valences, and the longer distances 2.5-2.8Å, indicate ionic bonding. In the K2Pb2Si3O7 structure, the lead polyhedra are flattened trigonal pyramids similar to those in the Pb3O4 structure, with distances of 2.2-2.3Å. This would indicate that the Pb coordination polyhedra in alamosite are of a mixed character. The 4-fold coordinated leads would have 2 Pb-O bonds of covalent character and 2 Pb-O bonds of ionic character; and the 3-fold coordinated lead would have 2 covalent bonds and one ionic bond.
-26-
LEAD-OXYGEN AND SILICON-OXYGEN INTERATOMIC DISTANCES
Si(1)-O(2) |
1.64 4Å |
Pb(1)O-(6) |
2.2 74Å |
O(4) |
1.6 80 |
O(7) |
2.6 25 |
O(5) |
1. 576 |
O(10) |
2.28 1 |
O(6) |
1. 574 |
||
Average |
1.6 19 |
Pb(2)-O(5) |
2. 520 |
O(6) |
2. 526 |
||
Si(2)-O(1) |
1.6 27 |
O(8) |
2.2 28 |
O(3) |
1. 713 |
O(9) |
2.2 06 |
O(7) |
1.6 68 |
||
O(8) |
1.6 05 |
Pb(3) -O(3) |
2. 286 |
Average |
1.6 53 |
O(7) |
2. 247 |
O(9) |
2. 521 |
||
Si(3)O-(3) |
1. 540 |
O(10) |
2.5 93 |
O(4) |
1.60 8 |
||
O(9) |
1.6 00 |
||
O(10) |
1.6 29 |
||
Average |
1. 594 |
Average of all Si-O distances
1.622Å
SILICON-SILICON and LEAD-LEAD INTERATOMIC DISTANCES
| Si(1)-Si(1) | 2.979Å | Pb(1)-Pb(2) | 3.786Å |
| Si(2)-Si(2) | 3.253 | Pb(2)-Pb(3) | 3.761 |
| Si(2)-Si(3) | 3.133 | Pb(3)-Pb(1) | 3.703 |
| Si(3)-Si(1) | 2.979 |
-27-
TABLE 8
OXYGEN-OXYGEN DISTANCES, SILICON-OXYGEN- SILICON AND OXYGEN-SILICON-OXYGEN ANGLES
Si( 1) tetrahedron |
O(4) |
O(5) |
O(6) |
|
O(2) |
2.62Å |
2.63Å |
2. 63Å |
|
104. 0° |
10 9.3° |
1 09.7° |
||
O(4) |
2.6 1Å |
2.7 0Å |
||
10 6.7° |
111. 8° |
|||
O(5) |
2. 65Å |
|||
11 4.8° |
||||
Si (2) tetrahedron |
O(3) |
O(7) |
O(8) |
|
O(1) |
2. 65Å |
2.6 8Å |
2.6 0Å |
|
10 4.9° |
1 08.7° |
1 15.3° |
||
O(3) |
2. 71Å |
2. 80Å |
||
106. 4° |
1 07.2° |
|||
O(7) |
2.7 4Å |
|||
11 3.8° |
||||
Si(3) tetrahedron |
O(4) |
O(9) |
O(10) |
|
O(3) |
2. 56Å |
2.6 1Å |
2. 55Å |
|
108.8° |
112.7° | 107.2° | ||
O(4) |
2.63Å | 2.63Å | ||
109.9° |
108.5° | |||
O(9) |
2.74Å | |||
109. 6° |
||||
Si(1)-O(2)-Si(1) 130.1°
Si(1)-O(4)-Si(3) 129.7°
Si(2)-O(1)-Si(2) 180.0°
Si(2)-O(3)-Si(3) 149.0°
-28-
Pb(1) shares all of its oxygens with the other leads, as do Pb(2) and Pb(3), except in the case of O(8) which is covalently bonded only to Pb(2). It is suggested that O(8) could have been bonded to Pb(1), ionically, but that the structure is such that the distance (2.89Å) is too great. O(10) is 2.81Å away from Pb(1), suggesting that the 2.8Å distance is too long for Pb-O bonding in alamosite.
The relation of the Pb-O bonds is reciprocal so that if an oxygen is covalently bonded (2.2-2.3Å) to one lead, it is ionically bonded (2.5-2.7Å) to the other lead. Each oxygen is bonded to one silicon and two leads, except for O(8) which is bonded to only one lead and one silicon. The lead polyhedra (including that of Pb(1) if O(8) may be included in its coordination for a moment) share edges with the lead polyhedra above and below it and are related then by a 31 psuedoscrew axis (Figures 8, 9) Further there are roughly three planes of atoms in the region of the lead polyhedra spiral chain, parallel to (010) about (1/3)y apart. Each plane has one lead and two oxygens; Pb(1), O(6), O(10) are at approximately -.05; Pb(3), O(5), O(7) at approximately .30; and Pb(2), O(8), O(9) at approximately .60. This would explain both the hexagonal psuedosymmetry and the perfect (010) cleavage of alamosite. Also, the chains of lead polyhedra in the b direction would account for the fibrous prismatic habit always observed in the b direction.
The alamosite structure is different in many respects when compared with other known pyroxene and pyroxenoid structures. Because
-29-
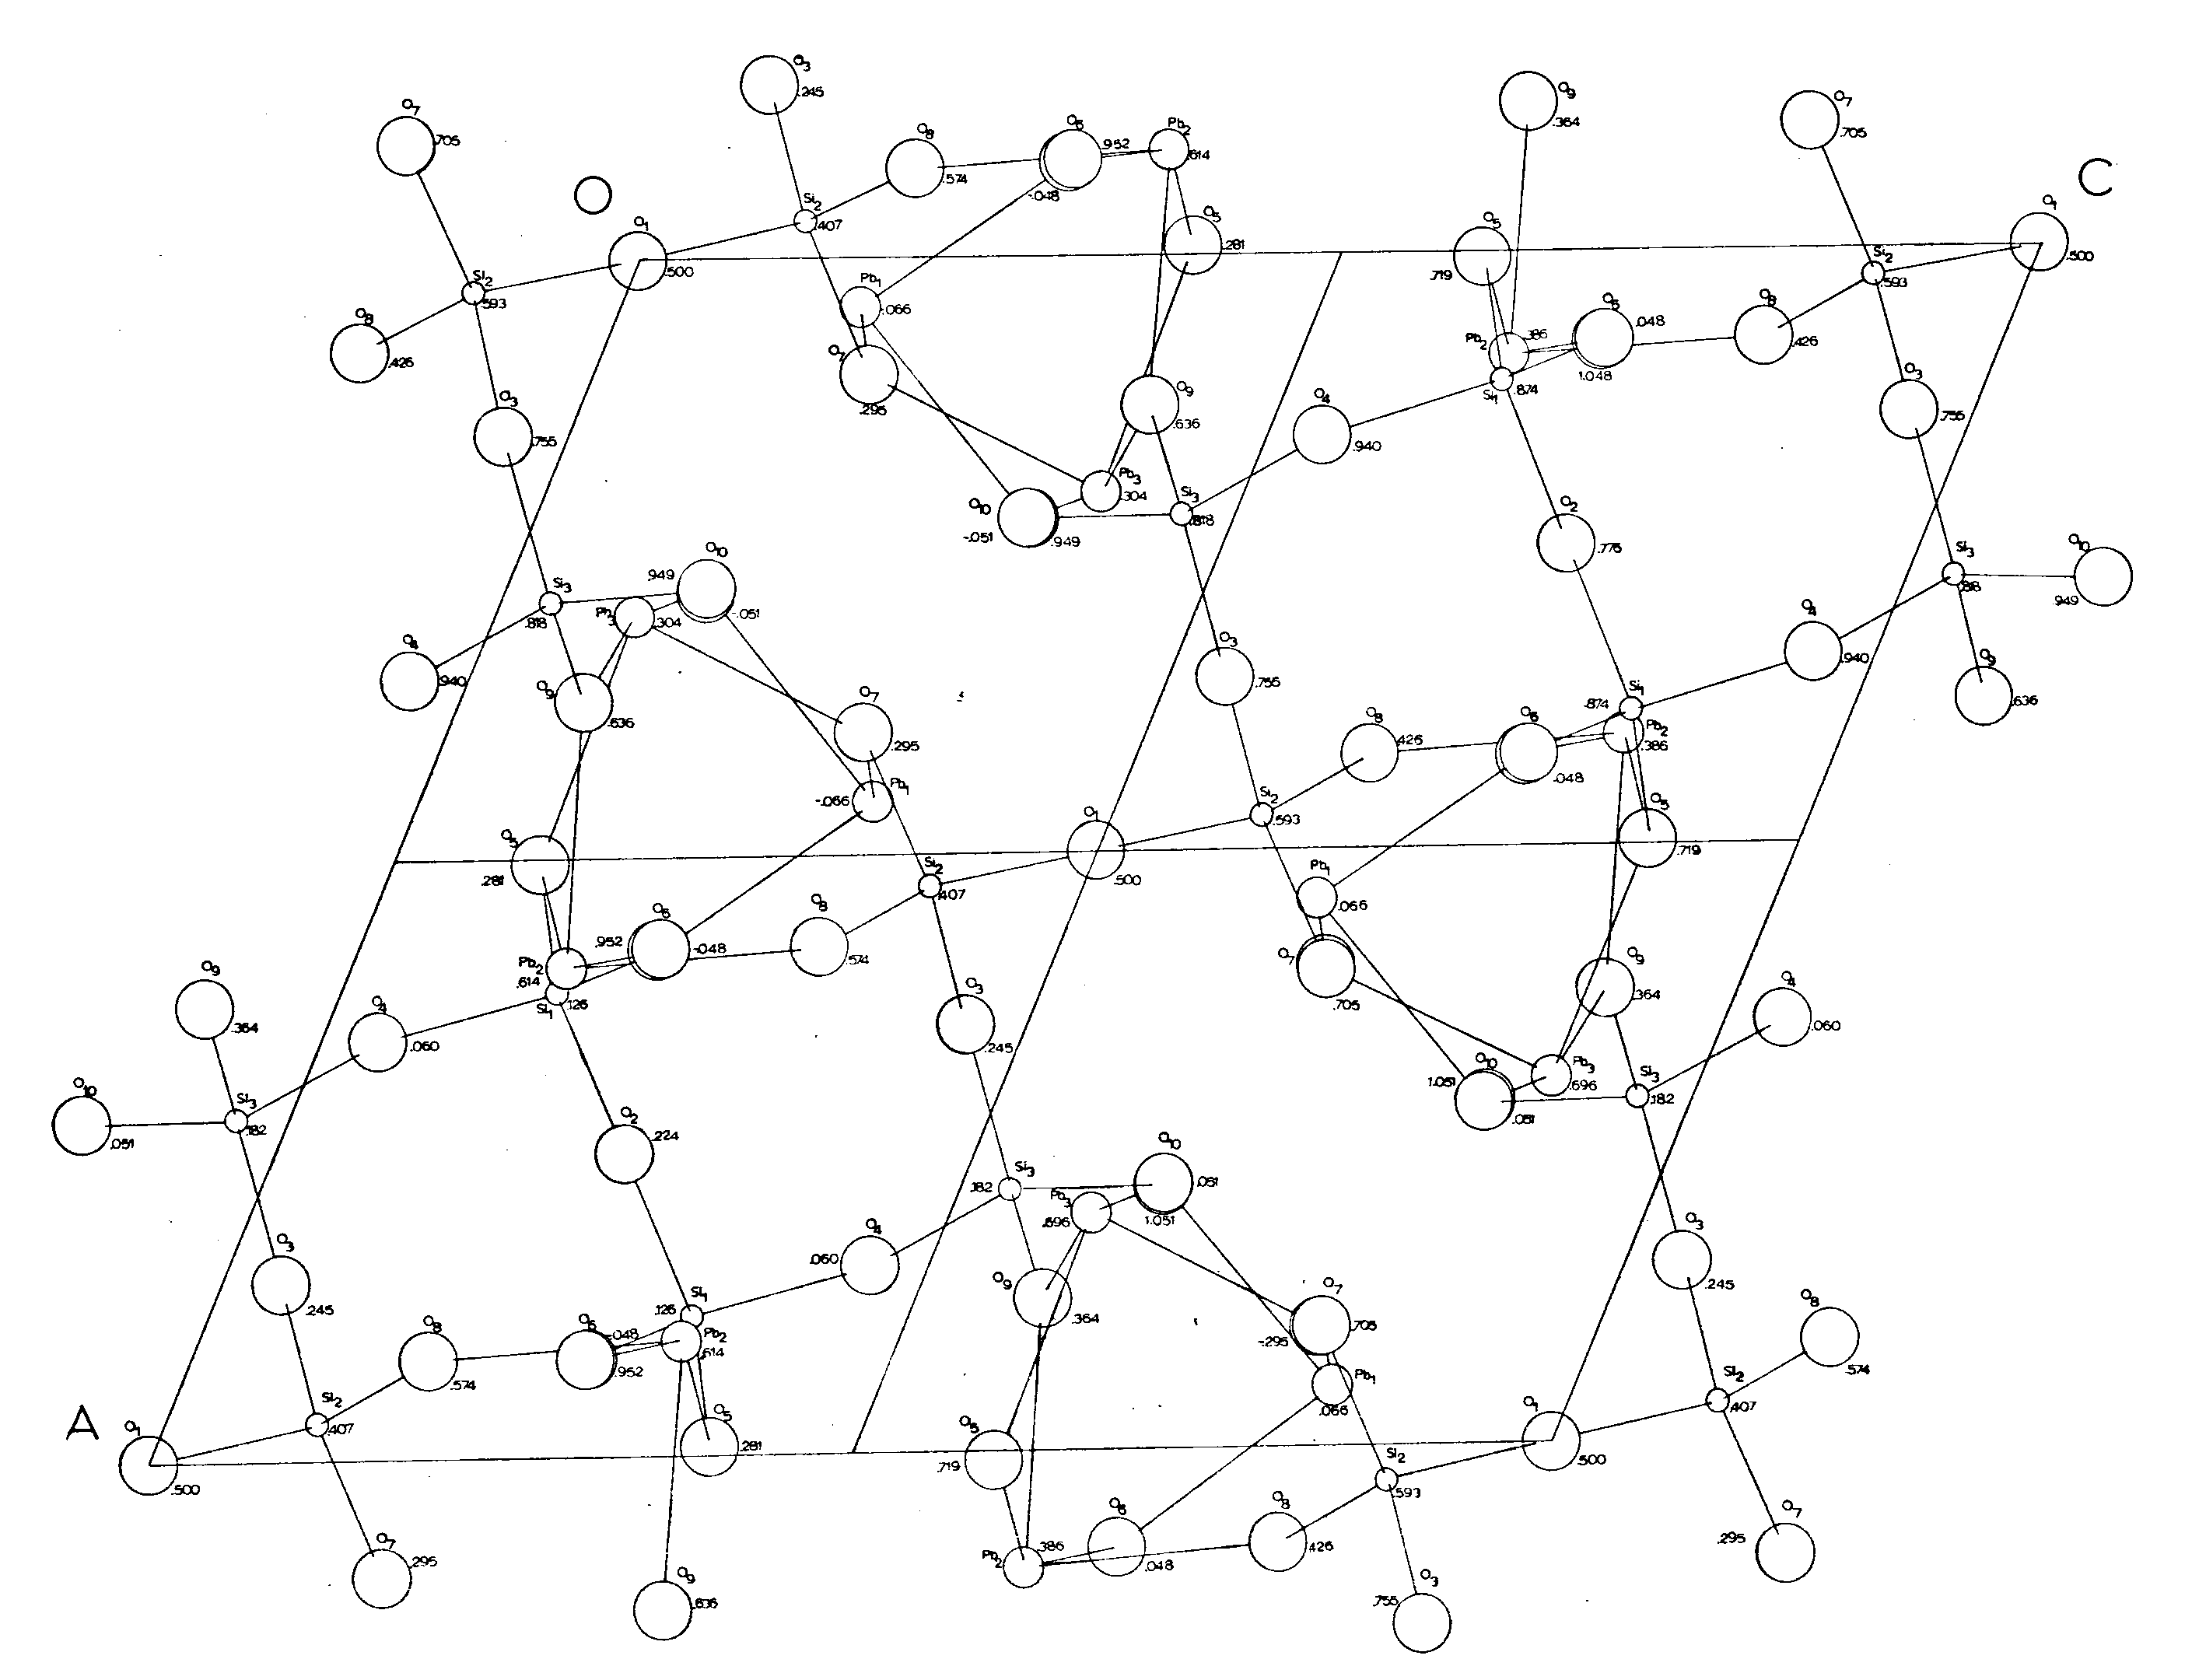
Figure 8. - Alamosite structure showing bonding relations in full cell projection. (P2/n cell). Cell height (y) is indicated beside each atom.
-30-
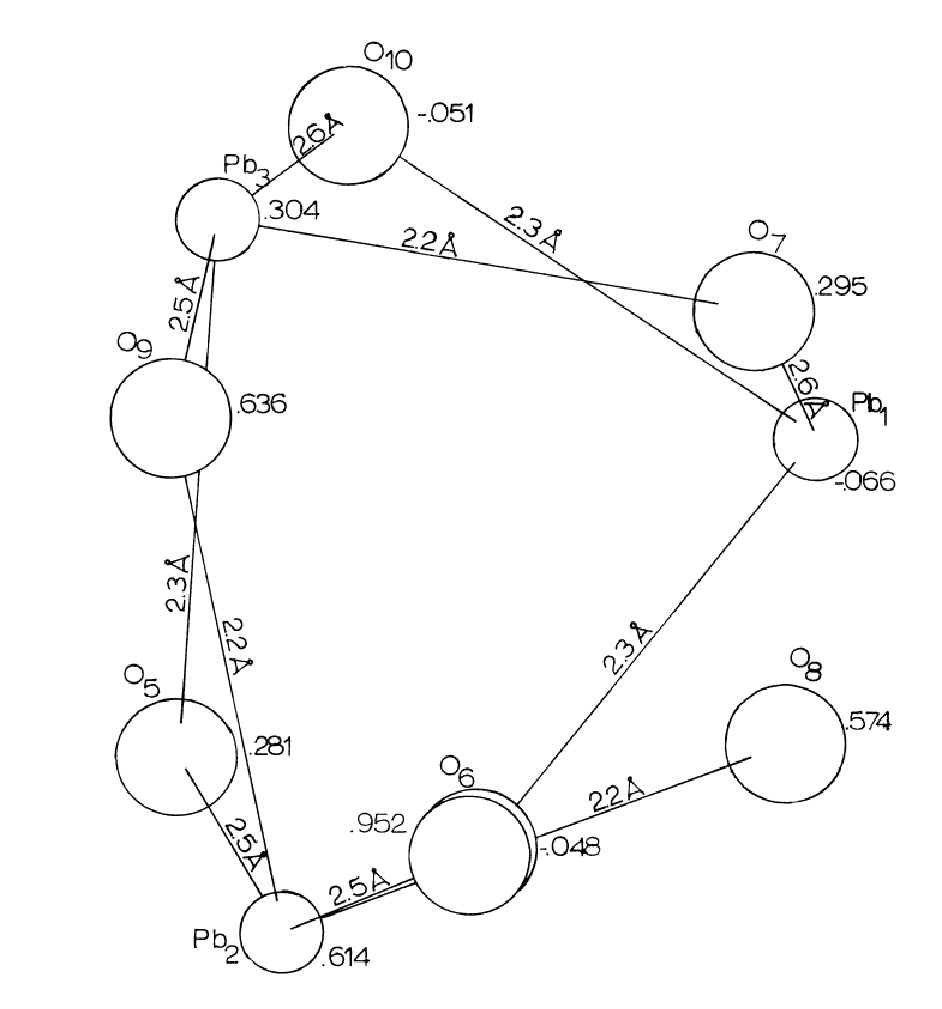
Figure 9. -Lead Polyhedral Chain in Alamosite, projected down the b-axis, P2/n.
-31-
of the size of its metal cation, Pb, the structure is not based on the closest packing of oxygens, but is a fairly open structure. In most other pyroxene-pyroxenoid structures, the metal cations are in octahedral, or larger, coordinated sites, and share edges to form bands which parallel the silicate chains (Prewitt and Peacor, 1964). In alamosite, although the lead polyhedra share edges (except Pb(1) ) and may be thought of as in bands, they differ from other pyroxenoids in that they are in chains perpendicular to the silicate chains. No edge sharing of the lead polyhedra with the silica tetrahedra occurs in alamosite as they do in other pyroxene-pyroxenoid structures that are known (Prewitt and Peacor, 1964). Also, although the silicate chain is based on a translation repeat unit of 12 tetrahedra, the chain is not related to a close-packed oxygen framework. It would seem that the only common feature of alamosite and other known pyroxene-pyroxenoid structures is that they are all based on a silicate chain structure, albeit in alamosite a unique chain structure.
-32-
SYNTHESIS OF ALAMOSITE
Much has been published on alamosite and other lead silicates by those in the glass and ceramic fields. Work has been done on melting points, stability fields, solid solution relations and simply on showing the existence or non-existence of certain phases.
None of the studies into the stability fields is quite complete and the PbO-SiO2 system has yet to be completely resolved. The three published phase diagrams (Cooper, Shaw, and Loomis (1909), and Hilpert and Nacken (1910), and Geller, Creamer, and Bunting (1934) ) all left out some phase or phases. The last work by Geller, Creamer, and Bunting (1934) left out barysilite, Pb3Si2O7 as a stable phase, and suggested instead a solid solution of PbSiO3 and Pb2SiO4. The latest published and most comprehensive work is by Berezkina and Chizikov (1962). They have shown the existence of several lead silicates and their relations, but have not published a phase diagram.
All the studies agree on the existence of the PbSiO3 phase and it was first synthesized in 1909, the same year that it was found to occur naturally as the mineral alamosite. It has been synthesized by Hilpert and Weiler (1909), Cooper, Kraus, and Klein (1912), and Van Nieuwenburg, and Blumendal (1931) with many others since then. Unfortunately, all except Van Nieuwenburg and Blumendal produced it as a phase in a glass matrix with crystals of very small size. The Van Nieuwenburg and Blumendal work was done pneumatolytically, with
-33-
excellent results, forming alamosite prisms up to 0.1 mm. in length. Following their procedure, the author attempted to synthesize alamosite, hoping to produce some crystals large enough and perfect enough for the intensity work.
With the help and direction of Dr. P. L. Cloke, and the use of his hydrothermal apparatus, the author made three attempts. The first run was made at 390 ± 5°C and 5500 psi. and held at this temperature and pressure for 3½ days. The bomb was charged with a mixture of yellow PbO and SiO2 glass, crushed to <140 mesh, which was sealed, with a calculated volume of water, in a copper tube. The copper tube was used to prevent any possible reactions with the Fe in the autoclave walls. The autoclave was allowed to cool slowly for 1½ days; then the tube was removed and cut open with a tube cutter. The resulting products were alamosite and quartz, which was confirmed by a diffractometer scan. (Table 9) Unfortunately, the crystals were too small for the intensity work.
The second run was similar to the first, but a temperature gradient was attempted, within the autoclave, by placing one end of it out of the furnace slightly and at about a 45° angle to horizontal. Seed crystals of natural alamosite cleavage fragments were placed in glass wool (SiO2) at the upper end of the copper tube and sealed. A calculated volume of water had been added and the temperature and pressure were the same as before, except for a time when a leak in the
-34-
system produced a temporary pressure drop. The results were some very clear rhombohedral plates of pure lead barysilite, whose overall unit cell dimensions were slightly larger than those of natural manganoan barysilite (Pb8Mn·3Si2O7). Some x-ray work was done by the author on the artificial barysilite and on samples of natural material from Langban, Sweden and from Franklin, New Jersey. The study was discontinued when it was found that the structure had recently been published.
The third run was similar to the first, and again produced crystals too small to use. At this point it was decided to use the natural material.
-35-
ALAMOSITE POWDER PATTERNS PbSiO3
Boucher |
Boucher |
McMurdie, Bunting, 1939 |
Berezkina, Chizikov, 1962 |
||||
Natural |
Synthetic |
Natural and Synthetic |
Synthetic |
||||
d |
I |
d |
I |
d |
I |
d |
I |
5.75 |
100 |
* |
5.82 |
m |
5.55 |
vw | |
4.435 |
vw |
||||||
4.23 |
vw |
||||||
3.79 |
vw |
||||||
3.55 |
95 |
3.52 |
100 |
3.58 |
s |
3.64 |
vw |
3.33 |
75 |
3.33 |
90 |
3.52 |
w |
||
3.25 |
70 |
3.22 |
90 |
3.44 |
m |
||
3.03 |
40 |
3.02 |
60 |
3.36 |
s |
3.39 |
m |
3.34 |
vw |
||||||
2.80 |
30 |
2.797 |
90 |
3.24 |
m |
3.2 |
vs |
3.095 |
w |
||||||
3.02 |
m |
3.01 |
w |
||||
Film, |
2.89 |
w |
2.91 |
w |
|||
Intensity |
Powder |
2.835 |
m |
||||
is visual |
Diffractometer |
2.78 |
m |
2.79 |
vs |
||
estimate |
2O=15-32 deg |
2.73 |
w |
||||
Scan 1 deg/min |
2.66 |
w |
2.68 |
m |
|||
Camera |
CuKa |
2.59 |
w |
2.573 |
vw |
||
Radius = |
Ni filter |
2.52 |
w |
2.513 |
vw |
||
114.58 mm |
35 Kv. |
2.47 |
w |
2.45 |
w |
||
CuKa |
15 ma. |
2.39 |
vw |
||||
Ni filter |
2.34 |
w |
2.328 |
m |
|||
35 kv. |
2.285 |
m |
2.28 |
w |
|||
15 ma. |
2.205 |
w |
2.192 |
w |
|||
12 hours |
2.135 |
w |
2.117 |
w |
|||
2.077 |
m |
||||||
2.07 |
w |
||||||
2.013 |
vw |
||||||
2.08 |
ww |
1.933 |
vw |
||||
2.050 |
ww |
1.917 |
vw |
||||
2.025 |
w |
1.886 |
w |
||||
1.928 |
m |
1.864 |
vs |
||||
Film |
1.808 |
w |
|||||
Intensity is |
1.779 |
w |
|||||
visual estimate |
1.757 |
vw |
|||||
Camera radius = |
1.706 |
s |
|||||
5.70 cm. |
1.682 |
vw |
|||||
1.644 |
vw |
||||||
CuKa-Ni filter |
1.614 |
s |
|||||
gas type 45 Kv., 4ma. |
1.563 |
m |
|||||
1.532 |
w |
||||||
1.513 |
vw |
||||||
F i lm, |
|||||||
Intensity is |
|||||||
visual estimate |
|||||||
RKU-86 Camera |
|||||||
70-100 hours |
-36-
ALAMOSITE SFLSQ CYCLE 32 ISOTROPIC TEMP FACTORS
(not
reproduced here)
-53-
*Indicates those referred to in this paper.
1. *Barnick, M., (1935) Naturwiss. V. 23, p. 770.
2. Benz, H. and H. Schmalzried (1961), Measurement of the free enthalpies of formation of solid phases in the system PbO-SiO2 with galvanic solid compound cells. Z. Physik. Chem. V. 29, pp. 77-82.
3. *Berezkina, L. G. and D. M. Chizhikov (1962), X-ray studies of compounds in the PbO-SiO2 system, Zhurnal Neorgan Icheskoi Khimii V. 7, pp. 856-859.
4. *Buerger, M. J. (1959), Vector Space, J. Wiley & Sons, N. Y.
5. *Busing, W. R., K. O. Martin, and H. A. Levy (1964) OR FFE, A Fortran crystallographic function and error program, Oak Ridge Nat. Lab (Oak Ridge, Tenn.) Rep. TM-306.
6. *Cooper, H. C., L. I. Shaw, and N. E. Loomis (1909) Lead silicates: thermal analysis of the system: PbO-SiO2, Am. Chem. Journ. V. 42, pp. 461-473.
7. *Cooper, H. C., E. H. Kraus, and A. A. Klein (1912) Lead silicates II, optical and thermal analysis of the system PbO-SiO2, Chem. Journ. V. 47, pp. 273-285.
8. *Cruickshank, D. W. J., H. Lynton and G. A. Barclay (1962), A reinvestigation of the crystal structure of thortveitite, Sc2Si2O7, Acta. Cryst. V. 25, pp. 491-498.
9. *Cruickshank, D. W. J. (1965), Errors in least-squares methods. Chapter in Computing Methods In Crystallography, edited by J. S. Rollett, Pergamon Press, Oxford.
10. Florinskaya, V. A. (1957), Transmission spectra of natural crystalline lead silicates and of crystallization products of 2-component lead silicate glasses in the Region 1-13 µ, Optika i Spectroskopiya V. 2, p. 724-37.
11. *Freed, R. L. (1967) The Structure and crystal chemistry of Margarosanite and Johansennite Ph.D. Thesis, University of Michigan.
12. *Geller, R. F., A. S. Creamer, and E. N. Bunting (1934) The System PbO-SiO2, N. B. S. Journ. Res. V. 13, pp. 237-44.
13. Geller, R. F. and E. N. Bunting (1936), The System K2O-PbO-SiO2, N. B. S. Journ. Res. V. 17, pp. 277-289.
14. *Hilpert, S. and P. Weiller (1909) Berichte Der Deutschen Chemischen Gesellschaft V. 42, p. 2969.
15. *Hilpert, S. and R. Nacken (1910) Berichte Der Deutschen Chemischen Gesellschaft V. 43 (II), p. 2565-73.
16. Ito, H. and T. Yanagase (1960), Lead silicate melts, Trans. Japan Inst. Metals V. 1, pp. 115-120.
17. Krakau, K. A., and N. A. Vachrameev (1932), Keram i Steklo V. 8 (1), p. 42.
18. Leventhal, M. (1965) A nuclear magnetic resonance investigation of the structure of Pb-borate and Pb-silicate glasses and associated crystalline compounds (Dissertation Abst.) V. 26 (1), pp. 447-8.
19. *Liebau, F.(1961) Untersuchungen uber die Grossedes Si-O-Si Valenzwinkels, Acta. Cryst. V. 14, pp. 1103-1109.
20. *Mackay, A. L. (1952), The Unit cell and space group of alamosite (PbSiO3), Min. Mag. V. 29, pp. 933-935.
21. McMurdie, H. F. and E. N. Bunting (1939), X-ray studies of compounds in the system PbO-SiO2, N. B. S. Journ. Res. V. 23, pp. 543-547.
22. *Merwin, H. E. (1914), Optical properties of azurite and alamosite, Wash. Acad. Sci. Journ. V. 4, pp. 253-254.
23. *Naray-Szabo, I., and A. Kalman (1961), Crystal structure of K2Pb2Si3O7 and of lead silicate glasses, Silikat Tech. V. 12, pp. 316-318.
24. Neumann, H., T. Sverdrup, and P. Chr. Saebo (1957) X-ray powder patterns for mineral identification #6, Avhandlinger Utgitt av Det Norske Videnskaps -Akademii Oslo Matematisk-Naturvidenskapelig Klasse.
25. *Palache, C. and H. E. Merwin (1909), Alamosite, a new lead silicate from Mexico, Amer. Journ. Sci. V. 177, pp. 399-401.
26. *Prewitt, C. T. (1962) SFLSQ2, an IBM 7090 program for least squares refinement, Ph.D Thesis, Mass. Inst. Tech.
27. *_____________ (1964) DFSET4, a program for computing equi-inclination-diffractometer settings. Central Research Department, Experimental Station, E. I. DuPont, DeNemours and Co.
28. *Prewitt, C. T. and D. R. Peacor (1964), Crystal chemistry of the pyroxenes and pyroxenoids, Am. Min. V. 49, pp. 1527-42.
-56-
29. Smirnova, E. V. (1965), Infrared and ultraviolet spectra of some glasses and crystalline silicates of the system PbO-SiO2, Dokl. Akad. Nauk. SSR V. 161 (3), pp. 569-571.
30. *Van Nieuwenburg, C. J. and H. B. Blumendal (1931), The pneumatolytic synthesis of silicates I, Recueil Des Travaux Chimigues des Pays-Bas V. 50, pp. 129-138.
31. Wyckoff, R., W. G. Wyckoff, H. E. Merwin, and H. S. Washington (1925), X-ray diffraction measurements upon the pyroxenes, Am. Journ. Sci. Ser. 5, V. 210, pp. 383-397.
32. *Zoltai, T. and M. J. Buerger (1959), The Crystal structure of coesite, the dense, high pressure form of silica, Zeit. Krist., V. 111, p. 129-141.